Introduction
RNA splicing, a key process in human genetics, has garnered considerable interest from the
machine learning community. Splicing involves removing regions from RNA transcripts and
joining the remaining segments together. Alternative splicing enables a single gene to
generate multiple output transcripts.
Understanding how specific RNA features dictate splicing outcomes remains a major challenge
in computational biology. Several convolutional neural networks have been developed to
predict splicing outcomes, but many of these networks are opaque and cannot explain the
reasoning that leads to their prediction. We previously introduced an "interpretable-by-design"
neural network to examine splicing logic. In contrast to these earlier models, our model is
both globally and locally interpretable, following a unified logic that can be used to trace
the decision-making process for each data point.
Here, we introduce a series of interactive visualizations that trace the model's reasoning
from input to output. This ability to visually dissect the model’s reasoning is particularly
valuable for the rational design of exons with targeted splicing results. It facilitates more
accurate manipulation of genetic sequences, allowing for the achievement of desired biological
effects with greater precision. Our goal with these visualizations is to provide a richer insight
into the mechanisms of splicing, thereby empowering researchers to predict and control splicing outcomes.
Background
RNA Splicing
The most common form of alternative splicing is exon skipping, which can lead to two distinct outcomes: exon inclusion or exon skipping. Before splicing, RNA transcripts are composed of exons interrupted by introns.
In exon inclusion, all introns are removed and all exons are joined together in the final transcript.
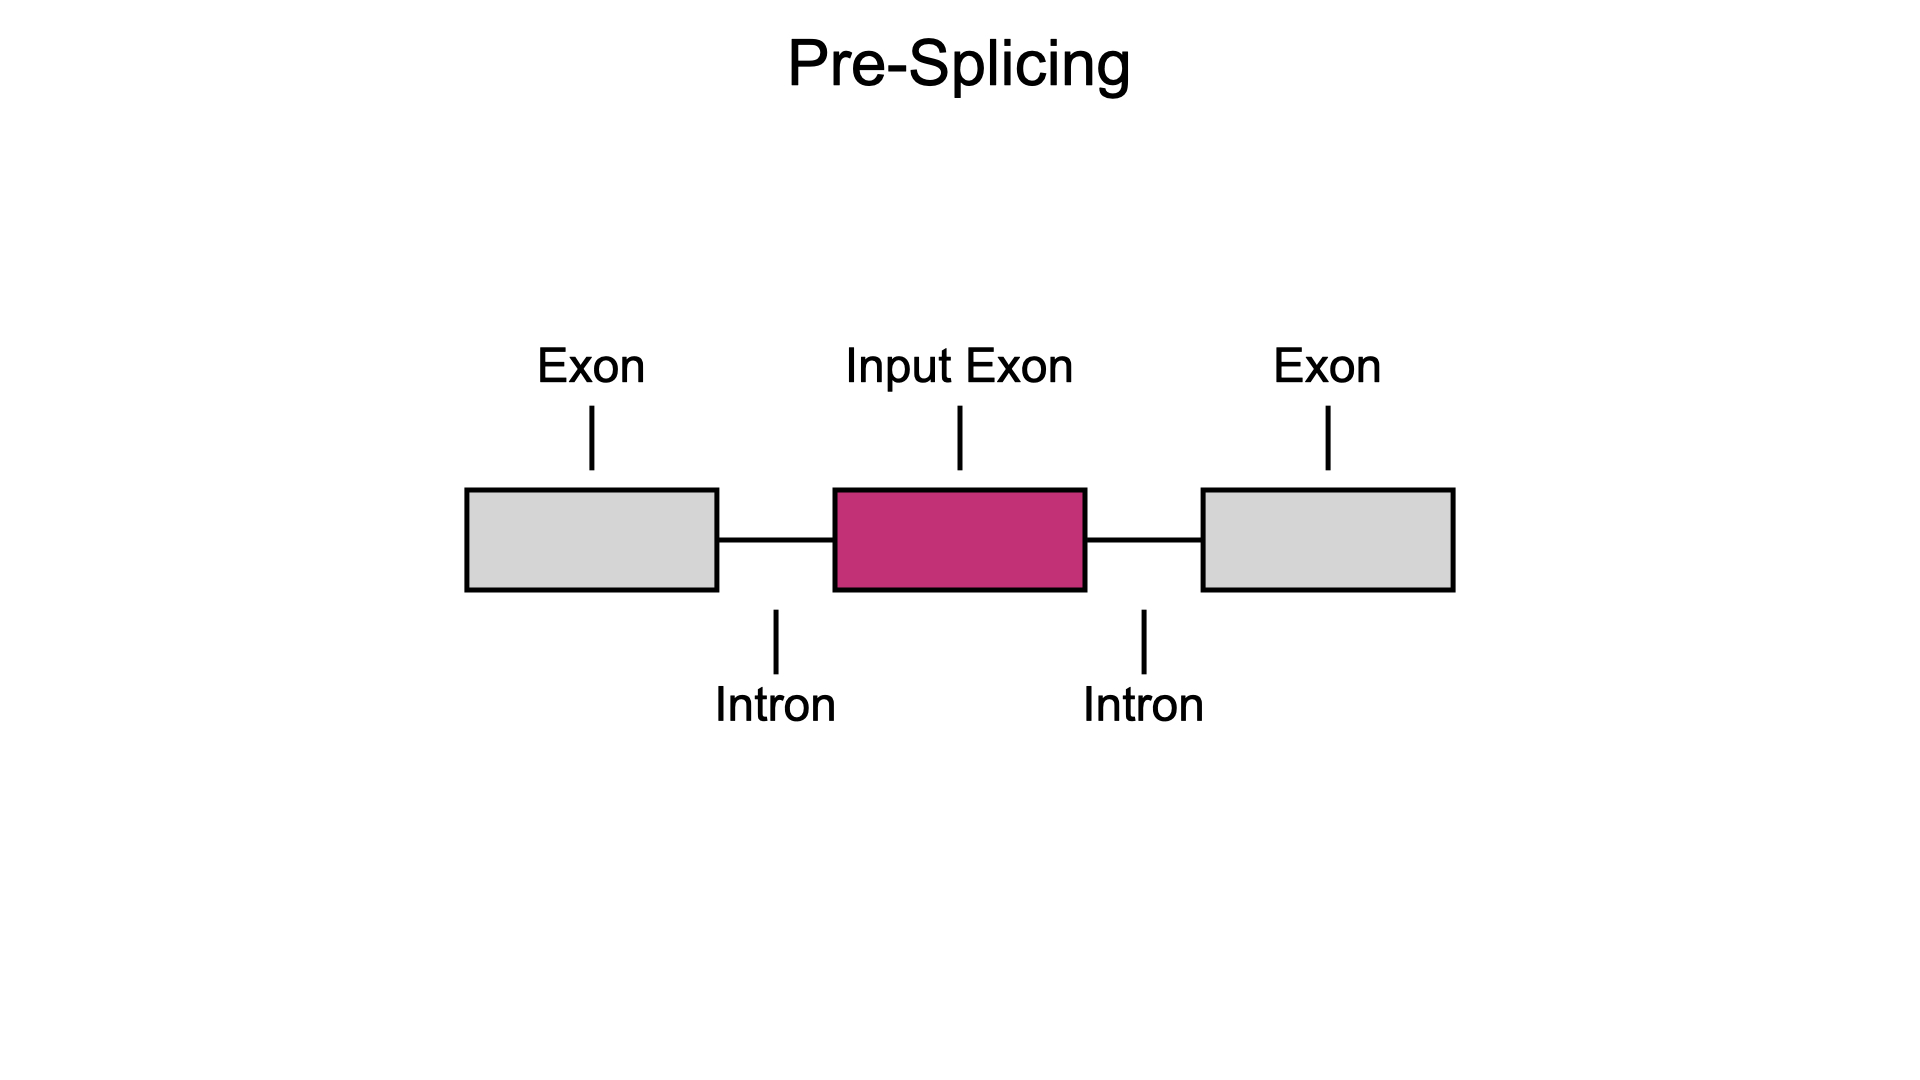
Conversely, in exon skipping, an internal exon is removed and excluded from the final product.
Dataset for model training
Our interpretable model was trained on a splicing dataset of over 300,000 random exons,
all within a fixed sequence background. This controlled dataset structure enables the
neural network to learn features associated with exon skipping or inclusion in an unbiased manner.
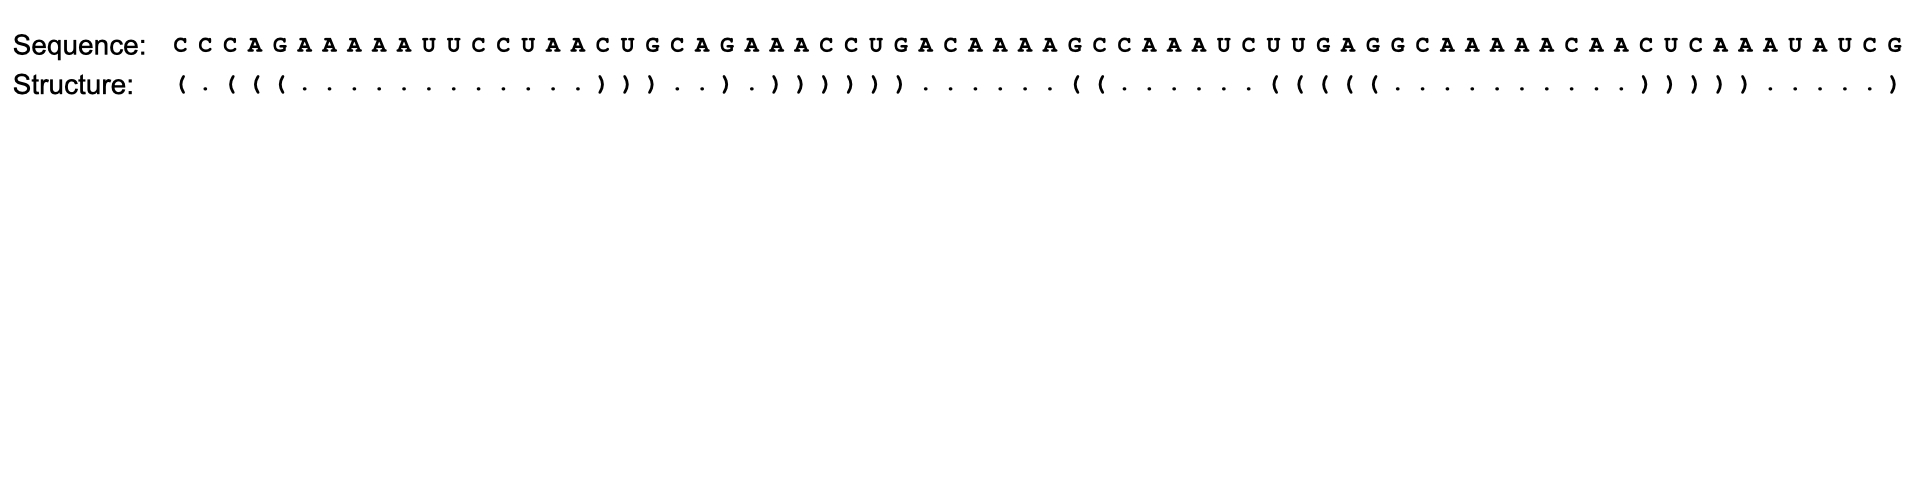
Since single-stranded RNA can often adopt secondary structures, the network used two inputs for
each exon - the 70-nucleotide sequence and a predicted secondary structure. We represent
secondary structure using standard dot-parenthesis notation, where matching parantheses
indicate base-pairing and dots represent unpaired bases.
 Click on the dot-parantheneses notation to view the RNA structure.
The dataset was fully-labelled, with each exon matched to experimentally measured
splicing outputs. The output is reported as percent spliced in (PSI) index,
the ratio of included exon products over all total post-splicing products.
Click on Exon 1, Exon 2, or Exon 3 to explore different inputs and outputs.
Input
Output
Visualizing network interpretability
Learning splicing features
The neural network was trained using fully-labeled data, where each exon input corresponds to a specific
PSI output. The network extracts information from the exon through one-hot encoding. In one-hot encoding,
sequence and structure information is converted into a binary vector.
For example, a nucleotide can be encoded as "hot" (1). The "hot" signal indicates whether the nucleotide
is A, C, G, or U. A matrix is used to represent a string of several nucleotides, where the nucleotide at
each position is hot-encoded.
One-hot encoding can also be used to represent RNA structural data. The "hot" signal can indicate whether a position is unpaired (dot) or paired (parenthesis).

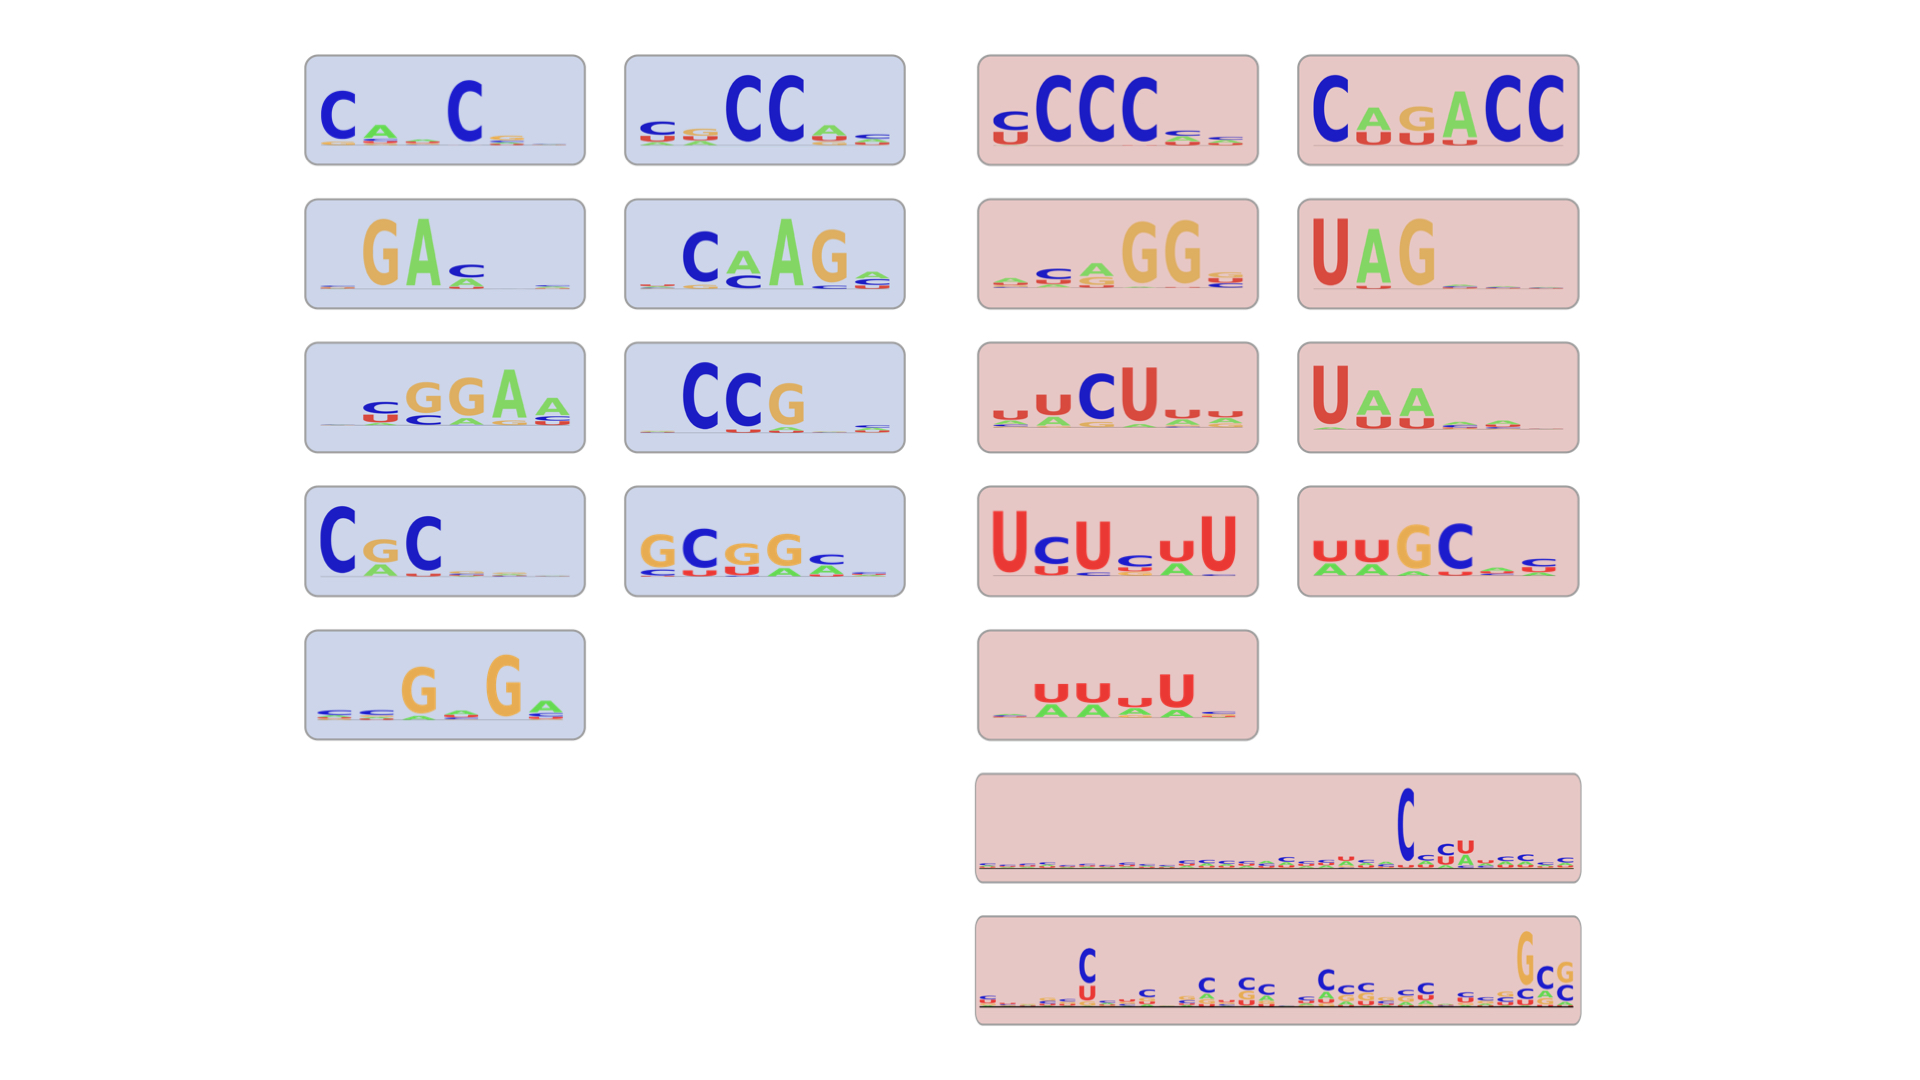
During training, the network identifies features that lead to inclusion or skipping by aggregating the one-hot encoded data. The frequency of a nucleotide or structure at a given position in a matrix is visualized as a heat map - where darker red indicates higher frequencies, and lighter colors represent lower frequencies.
These heat maps can be visualized as sequence logos, where the height of each nucleotide reflects its frequency at a specific position. In this example, the C nucleotides are prominently favored at specific positions, whereas other nucleotides are less preferred. Logo maps are commonly used in molecular biology to summarize conserved sequence and structure patterns.
After training, the network identified 20 total features that dictate splicing outcomes: 9 features contribute to exon inclusion, while 11 features contribute to exon skipping.
Examining how features inform splicing predictions
The network uses two inputs for each exon - the 70-nucleotide sequence and a predicted secondary structure.
In the final stage of the network, the network uses a learned non-linear function to convert the difference between inclusion and skipping strengths into a predicted PSI.
Click on points along the function to illustrate the non-linear relationship between Δ Strength and predicted PSI.
Examining predictions for specific inputs
Using this framework, we can also examine the local interpretability of the network on an individual exon.
Click on each step of to explore network logic on a specific input exon.
The network considers the input exon's sequence and structure.
We further introduce an interactive exon view that plots the strength contributions along the length of the exon. These visualizations map the inclusion and skipping strengths at nucleotide resolution. By clicking on an individual position in an exon, users highlight the sequence, structure, and features at the given position. We emphasize how a single nucleotide can contribute to multiple features by highlighting the relevant features in the legend, sort the features by strength in a hierarchical bar chart in nucleotide view, and provide a high-resolution map of features in nucleotide features.
Click on an individual nucleotide along the exon to highlight specific features that map to that nucleotide.
Rational design applications
One key aspect of interpretability is comparing the network’s reasoning process across multiple inputs.
At the local level, this involves examining how the network’s complex reasoning differs across input
instances, specifically examining how the network identifies different features across inputs yet follows
the same reasoning process to arrive at similar predictions. By analyzing reasoning across multiple input
instances, researchers can also gain insights into the global reasoning processing within a network.
The visualizations mapping inclusion and skipping features along the length of the exon demonstrate the
local interpretability of our model. These visualizations can be applied to a range of different questions
regarding rational design. Here, we focus on three specific applications:
(1) Comparing different exon inputs with the same output prediction
(2) Examining effects of mutations on splicing outcomes, and
(3) Generalizing to exons from other datasets.
Comparing different exon inputs with the same output prediction
One key aspect of interpretability is examining the network’s reasoning across different inputs. At the local level, this involves examining how the network’s complex reasoning differs across input instances, specifically examining how the network identifies different features across inputs yet follows the same reasoning process to arrive at similar predictions.
Our first use case for rational design demonstrates how different exons can result in the same predicted PSI.
We examined two exons from our dataset that had dramatically different inclusion and skipping profiles.
While the profiles of these exons were different, the calculated Δ Strength of both exons was -13.9,
leading to a predicted PSI output of 0.15.
We can further extend our analysis to observe multiple exons with the same PSI output.
Examining effects of mutations on splicing outcomes
A common benchmark for the performance of computational models is to experimentally validate predictions. One common approach is to perform single nucleotide mutagenesis - substituting one nucleotide for another (e.g. replacing A with G at a specific position in an exon). For machine learning researchers, mutagenesis provides an approach to probe whether the local interpretability of a neural network generalizes beyond the training and testing datasets. For molecular biology experts, comparing how well predictions from a computational model align with experimental laboratory measurements is a key indicator of model trustworthiness and interpretability. Furthermore, mutagenesis experiments are often used to model real-world disease mutations as single nucleotide splicing mutations have been directly implicated in several diseases. To illustrate how our visualizations can be useful for mutagenesis modeling, we generate exon view visualizations for a single mutation. Each visualization elucidates important facets of the network's local reasoning process.
Click on the exon labels to explore how a single mutation changes inclusion and skipping strengths.
Generalizing to exons with disease relevance
Finally, while our model was trained on a dataset of random exons with a fixed length,
we previously demonstrated that after minimal adjustments, our model accurately predicts
PSI for exons from the human genome. This demonstrates that our model generalizes to
other exons outside of the training dataset, highlighting the trustworthiness and
interpretability of the model.
The interpretability of our model features also has important implications for biomedical research.
Here, we highlight how our visualizations can demonstrate the divergent impact of two mutations on BRCA2,
one of the strongest genetic predictors of breast and ovarian cancer. In healthy adults, BRCA2 exon 7 is
entirely included. However, the Human Gene Mutation Database reveals that many breast and ovarian cancer
patients have mutations in BRCA2 exon 7. Thus, understanding whether specific BRCA2 exon 7 mutations
impact splicing outcomes can provide valuable insights into molecular disease mechanisms, identify
candidate biomarkers to trace disease progression, and guide the development of targeted therapies.
Some mutations have minimal effects on BRCA2 exon 7 splicing. For example, the 551T>C mutation
disrupts few splicing features and does not significantly alter PSI.
In contrast, the 620C>T mutation introduces multiple changes in predicted BRCA2 exon 7 structure. This single mutation dramatically changes the exon view silhouette to favor exon skipping.
Conclusion
In this interactive article, we present a series of visualizations designed to
enhance our understanding of an interpretable machine learning model. These novel
visualizations offer a detailed and intuitive way to map the features learned by the
model onto specific input sequences. By providing a clear visual representation of how
the model interprets and processes different splicing events, these tools allow researchers
to see exactly how various features dictate splicing outcomes. This capability is
particularly valuable for designing and engineering specific exons with targeted
splicing results, facilitating more precise manipulation of genetic sequences to achieve
desired biological effects. Through these visualizations, we aim to provide a deeper
insight into the mechanisms of splicing and improve our ability to predict and control
splicing outcomes in genetic research and applications.